Interessieren Sie sich für Finanz- und Wirtschaftsnachrichten ?
Die Bank Bonhôte heisst Sie herzlich willkommen und stellt Ihnen Ihre Finanz-Experten gerne zur Verfügung.


| USD/CHF | EUR/CHF | SMI | EURO STOXX 50 | DAX 30 | CAC 40 | FTSE 100 | S&P 500 | NASDAQ | NIKKEI | MSCI Emerging MArkets | |
|---|---|---|---|---|---|---|---|---|---|---|---|
| Latest | 0.94 | 1.07 | 10'410.52 | 3'365.60 | 12'919.61 | 5'069.42 | 5'935.98 | 3'224.73 | 10'503.19 | 22'696.42 | 1'055.06 |
| Trend | |||||||||||
| %YTD | -3.00% | -1.18% | -1.94% | -10.13% | -2.49% | -15.20% | -21.30% | -0.19% | 17.06% | -4.06% | -5.35% |
The pandemic is still making inroads. In the US, daily records for new coronavirus cases were broken last week, and India re-confined practically 10% of its population. Meanwhile hopes of a vaccine – following Moderna’s breakthrough – supported financial markets, although investors were unnerved by worsening China-US relations and the approaching US elections.
The ECB’s policy meeting went off as expected. Benchmark rates were kept in negative territory and purchases of ‘peripheral’ bonds are continuing, especially Italian BTPs. Christine Lagarde called on European leaders to quickly rally round the ‘ambitious’ EUR 750bn recovery fund, designed to support those member states hit hardest by the pandemic. Today marks the fourth day of talks as the European Council, meeting in Brussels, seeks to clinch a final agreement. Rumour has it that grants amounting to EUR 390bn and cheap loans of EUR 360bn is one formula on which common ground could be found.
The current reporting season will tell us just how harmful the lockdown has been for the economy and could prompt governments to pile on more stimulus. US banking majors, who got the ball rolling last week, reported surges in trading income. Beating Goldman Sachs, which posted profit of USD 2.4bn (on a par with the same period last year), Morgan Stanley’s bottom line rocketed by 45% to USD 3.2bn. But banks with big loan books – commercial or retail – were forced to set aside huge loan-loss provisions, which dented their earnings. For example Bank of America’s earnings fell by half after it allocated USD 5.1bn to bad debt.
The plethora of economic stats reported last week were mixed. In the US, industrial production rose by 5.4% month-on-month in June and retail sales recovered by 7.5%. But 1.3 million individuals signed on as jobseekers in the week from 5 to 11 July, bringing the total to 17.33 million.
The Fed’s next policy meeting is 28-29 July. In its recent Beige Book, it drew attention to the hazy outlook on the pandemic. Business activity remains far below pre-Covid levels, warranting continuation of an accommodative monetary policy.
China’s GDP in the second quarter rose by 3.2% year-on-year, beating the 2.5% consensus growth forecast. But retail sales disappointed, declining by 1.8% in June year-on-year versus an expected 0.5% increase, pouring cold water on the prospect of a strictly V-shaped recovery.
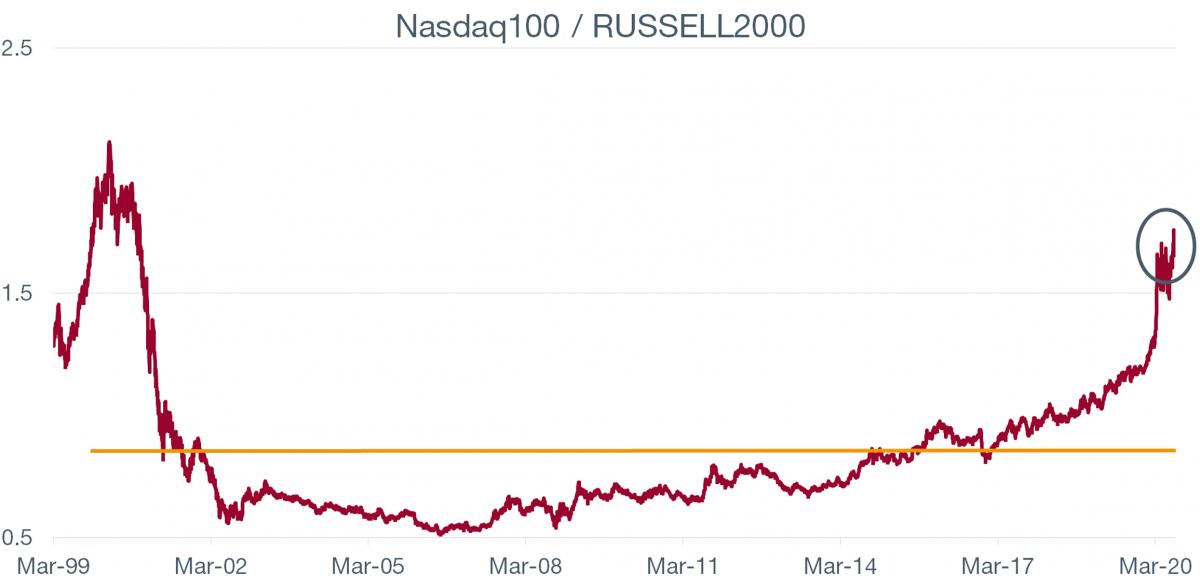
There is talk in the financial press of a bubble forming on the Nasdaq 100, which represents the leading tech stocks in the US market. And for good reason: the following chart shows the Nasdaq relative to the Russell 2000 index of the leading small and mid caps in the US.
The orange line represents the historical average of the Nasdaq100/Russell2000 ratio. The red line shows the ratio where it currently is – miles away from this average and heading for the levels seen shortly before the TMT bubble burst in the early 2000s.
Nothing hints at a reversal of the trend except perhaps the widening valuation gap. The median P/E of the Nasdaq has climbed to 29x earnings versus 19x for the Russell 2000. The Nasdaq has gained 22% year to date whereas the Russell 2000 has shed 11% of its value. Once again for each index, the heavyweights are driving positive performances. The median year-to-date performance for all stocks in the Russell 2000 is a dire -22%.
Outperformance by Nasdaq 100 relative to Russell 2000 stretches to highest level in 20 years. When will the bubble burst?

Download the Flash boursier (pdf)
This document is provided for your information only. It has been compiledfrom information collected from sources believed to be reliable and up to date, with no warranty as to its accuracy or completeness.By their very nature, markets and financial products are subject to the risk of substantial losses which may be incompatible with your risk tolerance.Any past performance that may be reflected in this documentis not a reliable indicator of future results.Nothing contained in this document should be construed as professional or investment advice. This document is not an offer to you to sell or a solicitation of an offer to buy any securities or any other financial product of any nature, and the Bank assumes no liability whatsoever in respect of this document.The Bank reserves the right, where necessary, to depart from the opinions expressed in this document, particularly in connection with the management of its clients’ mandates and the management of certain collective investments.The Bank is a Swiss bank subject to regulation and supervision by the Swiss Financial Market Supervisory Authority (FINMA).It is not authorised or supervised by any foreign regulator.Consequently, the publication of this document outside Switzerland, and the sale of certain products to investors resident or domiciled outside Switzerland may be subject to restrictions or prohibitions under foreign law.It is your responsibility to seek information regarding your status in this respect and to comply with all applicable laws and regulations.We strongly advise you to seek independentlegal and financial advice from qualified professional advisers before taking any decision based on the contents of this publication.